


The Conversation
Tony Abbott, once the 'climate weathervane', has long since rusted stuck
Tonight former Prime Minister Tony Abbott will be in London to give a speech to the Global Warming Policy Foundation, titled “Daring to Doubt”, in which he will reportedly argue that climate policy is “shutting down industries”. (It’s not clear if he’s bought carbon offsets for the 10 tonnes of carbon that a return flight to the UK will release into the atmosphere.)
Whatever talking points and soundbites he presents will inevitably be interpreted as yet another salvo in the Coalition’s ferocious and interminable war over energy and climate policy.
Read more: Two new books show there’s still no goodbye to messy climate politics
The venue is the same one where Abbott’s mentor John Howard U-turned on his earlier climate policy U-turn. In a 2013 speech, Howard disparagingly declared that “one religion is enough”, despite having belatedly pledged in 2006 to introduce an emissions trading scheme, only to lose to Kevin Rudd the following year.
Who are the GWPF anyway?The Global Warming Policy Foundation was set up in 2009 by Nigel Lawson, who in the 1980s served as Chancellor of the Exchequer (the UK equivalent of treasurer) in Margaret Thatcher’s government, but is arguably more famous these days as Nigella’s dad.
The foundation was founded just days after the first so-called “Climategate” emails were leaked. But after complaints, in 2014 the UK Charity Commission rejected the notion that the organisation provides an educational resource, concluding that:
The [GWPF] website could not be regarded as a comprehensive and structured educational resource sufficient to demonstrate public benefit. In areas of controversy, education requires balance and neutrality with sufficient weight given to competing arguments.
Ahead of the Commission’s report, the Global Warming Policy Forum was born as the organisation’s campaigning arm, free from the regulations that govern charities.
Despite its loud demands for crystal-clear transparency about climate science, and its repeated claims that scientists are swayed by big fat grants, the GWPF is oddly cagey about its own funding. In a 2012 BBC Radio programme, Lawson said he relied on friends who “tend to be richer than the average person and much more intelligent than the average person”. An investigation by the website DeSmog has dug up some more information.
More recently the GWP Forum has been in the news because it appointed a pro-Brexit oil company boss to its board and because in August Lawson appeared on BBC Radio to attack Al Gore, accusing the Nobel prizewinning climate activist of peddling “the same old claptrap” and adding: “People often fail to change and he says he hasn’t changed, he’s like the man who goes around saying ‘the end of the world is nigh’ with a big placard”.
Read more: A brief history of Al Gore’s climate missions to Australia
Lawson wasn’t done. He also claimed that “according to the official figures, during this past 10 years, if anything, mean global temperature, average world temperature, has slightly declined”.
Factcheckers were quick off the mark, and the BBC was chided by, among others, Professor Brian Cox (a year on from bringing his graph to Q&A to try to educate the British-Australian politician Malcolm Roberts).
Days later Lawson admitted that his figures were not from the Intergovernmental Panel on Climate Change, but from a meteorologist who works for the Cato Institute, a libertarian think tank founded by Charles Koch.
Abbott the weathervaneAnyway, back to Abbott. Digging around in the archives throws up some amusing surprises about him, as befits a man who has been making headline since 1977. In 1994 an environmental campaign to recreate Tasmania’s Lake Pedder found an unusual ally in the newly minted Member for Warringah, who wrote an article in The Australian that plaintively asked:
If we can renovate old houses and old cars, rejuvenate works of art, recreate forgotten languages and restore degraded bushland, why can’t we rehabilitate the site of a redundant dam?
Abbott seems not to have been particularly exercised by climate policy during the first decade of his parliamentary career. But once the issue hit the top of the political agenda, Abbott was – in his own words to Malcolm Turnbull – “a bit of a weathervane”.
He helped convince Howard to agree to some sort of ETS proposal during the ultimately futile bid to fend off Kevin Rudd in 2007. In July 2009, in a front-page story in The Australian headed “Abbott – we have to vote for ETS”, he was quoted as saying:
The [Rudd] government’s emissions trading scheme is the perfect political response to the public’s fears. It’s a plausible means to limit carbon emissions that doesn’t impose any obvious costs on voters.
However, by September 2009, with Malcolm Turnbull’s leadership on the rocks (remember Godwin Grech?), Abbott made a fateful trip to Beaufort in rural Victoria, and discovered that the room loved him saying “climate change is absolute crap”. The weathervane had made an abrupt about-face.
As Paul Kelly notes in his 2014 opus Triumph and Demise, then-Senator Nick Minchin was crucial in convincing Abbott that there was no serious electoral price to be paid in opposing Kevin Rudd’s Carbon Pollution Reduction Scheme.
Turnbull was on the ropes, and Abbott won the leadership ballot by one vote. As David Marr recounts, the party was almost as stunned as the nation. “God Almighty,” one of the Liberals cried in the party room that day. “What have we done?”
The ensuing years need no extended recap, though two points are worth mentioning. The first is the admission by Abbott’s former chief of staff Peta Credlin that the “carbon tax” that was going to be the end of the world… wasn’t a carbon tax.
The second is that former environment minister Greg Hunt recently rebutted the claim that backbenchers prevented further cuts to the Renewable Energy Target under Abbott’s prime ministership.
Backed into a cornerThe upshot is that Abbott has, as Philip Coorey recently observed, totally painted himself into a corner on energy and renewables.
Mind you, it may not matter that much to him, given that his apparent aim is not to “do a Rudd” and return to the helm, but simply to drive a wrecking ball through Malcolm Turnbull’s prime ministership – with climate and energy policy as collateral damage.
Read more: Coal and the Coalition: the policy knot that still won’t untie
As Abbott accepts another pat on the back from a roomful of climate deniers in London, we may wonder how long business interests in Australia will tolerate his wrecking, undermining and sniping. There is bewilderment and dismay at the destabilising effect on policy.
Among the business lobby, BHP has evidently forced the departure of Brendan Pearson as head of the Minerals Council in protest at the council’s similarly backward stance. That much is within their gift. But with regard to the Coalition government, those businesses can do little but despair at the handful of recalcitrant MPs who have nominated climate policy as the ditch in which they will die, in service of the culture war.
The hot air just doesn’t seem to be letting up, any more than our hot summers will in the future.
To keep heatwaves at bay, aged care residents deserve better quality homes
 Living in a single-storey unit can lead to much higher air conditioning costs. Author provided
With rising temperatures, surging power prices and an ageing population, there are challenging times ahead in terms of looking after our most vulnerable elderly citizens.
But my research suggests that residential aged care facilities are not well regulated in terms of providing safe indoor temperatures, especially during hot summer months.
Heatwaves have caused more deaths in Australia over the past 200 years than floods or cyclones. People over 75 are more at risk of temperature-related health issues, and some are even more at risk than others. The most vulnerable groups include women, people living alone, people on low incomes, and people with existing health or mobility issues.
 Vulnerable subgroups of elderly population.
Wendy Miller
Vulnerable subgroups of elderly population.
Wendy Miller
By mid-century, more than 2 million Australians will be aged 85 or over, and more than a quarter of these are likely to find themselves living in residential aged care facilities. These communities, often resembling retirement villages, cater to the needs of older people with varying levels of care needs in terms of their health, mobility and independence.
Aged care homes are strongly regulated by national laws governing their terms of occupancy, fees, fire safety procedures, and service costs such as electricity bills. But this regulation does not seem to extend to thermal comfort.
 Population distribution of older people.
Derived from Australian Demographic Statistics June 2014, ABS
Comfortable buildings
Population distribution of older people.
Derived from Australian Demographic Statistics June 2014, ABS
Comfortable buildings
My research team has been investigating how buildings at an aged care community in southeast Queensland impact on internal temperatures and occupant electricity bills. Residents in this community are aged 80 or older and most live alone. We measured inside and outside temperatures in 11 apartments and evaluated the electricity bills of all 110 apartments. We also inspected the design and construction of the buildings.
On average, residents used only 80% of the monthly electricity assumed by the Queensland government for low-energy-consumption households. Actual monthly electricity bills (excluding metering and connection charges) ranged between 1% and 6% of the 2015 aged care pension rate.
Read more: How to keep your house cool in a heatwave
Next, we examined the 20 apartments with the highest electricity bills. Eighteen of them were directly exposed to the roof – that is, they were either in a single-storey apartment building or on the upper floor of a two-storey building.
Electricity bills also seemed to be linked to the weather. In some units, winter and summer bills were 60-70% higher than the corresponding bills in autumn and spring. In the most extreme cases, summer electricity bills were four to five times higher than at other times of year. Some units required winter heating, while others did not.
This huge variation in electricity bills suggests that building quality plays a part in determining how much residents have to spend to stay cool in summer. To find out, we next compared the temperatures inside two identical, unoccupied units – one on the ground floor and one directly above – during a run of hot summer weather.
The ground floor unit had a more consistent internal temperature and a lower maximum temperature in every room (bedroom, bathroom and kitchen/living room). What’s more, all rooms in the ground floor unit had a greater proportion of time in the comfort zone of 20℃ and 26℃, and never got hotter than 28℃.
 Temperature comparison of lower floor (left) and upper floor (right) apartments.
Wendy Miller
Temperature comparison of lower floor (left) and upper floor (right) apartments.
Wendy Miller
This doesn’t mean that air conditioning wouldn’t be required, but it does mean that cooling costs for the ground floor unit would be significantly cheaper than for the unit directly upstairs.
Building quality – the absence of ceiling insulation in this case – is impacting on the internal temperatures of these apartments and on the occupants’ electricity bills. It’s an important issue considering that air conditioning is typically the biggest factor in these communities’ energy costs.
 Impact of heat and housing on elderly people and society.
What do we need to do about this?
Impact of heat and housing on elderly people and society.
What do we need to do about this?
This is not an accusation of wrongdoing by the developers and managers of aged care communities. But our results do highlight a serious issue in our approach to energy, buildings and health, especially the increasing heatwave risk to our growing elderly population.
With that in mind, a few questions need answering:
Are building regulations really protecting the health and safety of older people?
Why isn’t building quality considered as part of the healthcare plan of older Australians?
Why do we rely so much on air conditioners to pump heat out of the building, instead of first doing what we can to limit the heat getting into our buildings in the first place.
Why do governments try to control electricity prices but virtually ignore energy efficiency?
Why aren’t buildings included in the current discussion about the electricity network, reliability and security?
Why do we continue to focus on subsidising pensioners’ electricity bills, instead of tackling the problem at source by improving the buildings they live in?
Are the buildings constructed now going to be fit for purpose in the changing climate?
Will poor-quality buildings end up being stranded assets in the future?
We have a disconnect between our building quality, energy system, electricity costs and the well-being of our elderly citizens. This does not make Australians safe and secure – something that anyone in aged care would surely wish to be.
Wendy Miller receives funding from the Australian Research Council to examine housing innovation and sustainability. No funding was received from the management of the aged care community that was the subject of this research. This community, however, does provide our research team with access to their buildings and energy data.
After the storm: how political attacks on renewables elevates attention paid to climate change
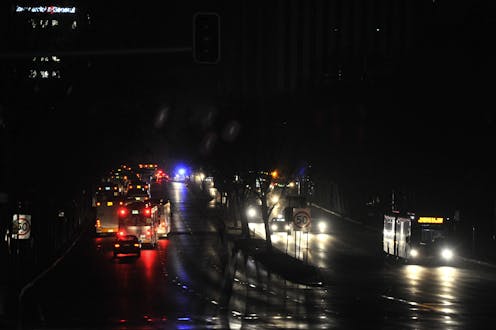 AAP/David Mariuz
This time last year, Australia was getting over a media storm about renewables, energy policy and climate change. The media storm was caused by a physical storm: a mid-latitude cyclone that hit South Australia on September 29 and set in train a series of events that is still playing itself out.
The events include:
an extraordinary attack on renewables by federal government ministers;
a steadfast pushback by the South Australian government to continue its renewables roll-out;
the offer of tech entrepreneur Elon Musk to build the largest battery storage facility in the world in South Australia and;
the Finkel Review.
In one sense, the Finkel Review was a response to the government’s concerns about “energy security”. But it also managed to successfully respond to the way energy policy had become a political plaything, as exemplified by the attacks on South Australia.
New research on the media coverage that framed the energy debate that has ensued over the past year reveals some interesting turning points in how Australia’s media report on climate change.
While extreme weather events are the best time to communicate climate change – the additional energy people are adding to the climate is on full display – the South Australian event was used to attack renewables rather than the carbonisation of the atmosphere. Federal MPs hijacked people’s need to understand the reason for the blackout “by simply swapping climate change with renewables”.
However, the research shows that, ironically, MPs who invited us to “look over here” at the recalcitrant renewables – and not at climate-change-fuelled super-storms – managed to make climate change reappear.
The study searched for all Australian newspaper articles that mentioned either a storm or a cyclone in relation to South Australia that had been published in the ten days either side of the event. This returned 591 articles. Most of the relevant articles were published after the storm, with warnings of the cyclone beforehand.
Some of the standout findings include:
51% of articles were about the power outage and 38% were about renewables, but 12% of all articles connected these two.
20% of articles focused on the event being politicised by politicians.
9% of articles raised climate change as a force in the event and the blackouts.
10% of articles blamed the blackouts on renewables.
Of all of the articles linking power outages to renewables 46% were published in News Corp and 14% were published in Fairfax.
Narratives that typically substituted any possibility of a link to climate change, included the “unstoppable power of nature” (18%), failure of planning (5.25%), and triumph of humanity (5.6%).
Only 9% of articles discussed climate change. Of these, 73% presented climate change positively, 21% were neutral, and 6% negative. But, for the most part, climate change was linked to the conversation around renewables: there was a 74% overlap. 36% of articles discussing climate change linked it to the intensification of extreme weather events.
There was also a strong correlation between the positive and negative discussion of climate change and the ownership of newspapers.
The starkest contrast was between the two largest Australian newspaper groups. Of all the sampled articles that mentioned climate change, News Corp was the only group to has a negative stance on climate change (at 50% of articles), but still with 38% positive. Fairfax was 90% positive and 10% neutral about climate change.
 Positive/negative stance of articles covering climate change by percentage.
Given that more than half of all articles discussed power outages, the cyclone in a sense competed with renewables as a news item. Both have a bearing on power supply and distribution. But, ironically, it was renewables that put climate change on the news agenda – not the cyclone.
Of the articles discussing renewables, 67% were positive about renewables with only 33% “negative” and blaming them for the power outages.
In this way, the negative frame that politicians put on renewable energy may have sparked debate that was used to highlight the positives of renewable energy and what’s driving it: reduced emissions.
But perhaps the most interesting finding is the backlash by news media against MPs’ attempts to politicise renewables.
19.63% of all articles in the sample had called out (mainly federal) MPs for politicising the issue and using South Australians’ misfortune as a political opportunity. This in turn was related to the fact that, of all the articles discussing renewables, 67% were positive about renewables with only 33% supporting MPs’ attempts to blame them for the power outages.
In this way, while many MPs had put renewables on the agenda by denigrating them, most journalists were eager to cover the positive side of renewables.
Nevertheless, the way MPs sought to dominate the news agenda over the storm did take away from discussion of climate science and the causes of the cyclone. Less than 4% of articles referred to extreme weather intensifying as a trend.
This is problematic. It means that, with a few exceptions, Australia’s climate scientists are not able to engage with the public in key periods after extreme weather events.
When MPs, with co-ordinated media campaigns, enjoy monopoly holdings in the attention economy of news cycles, science communication and the stories of climate that could be told are often relegated to other media.
With thanks to Tahnee Burgess for research assistance on this article.
David Holmes received funding from Monash University to conduct this research.
Revenge served cold: was Scott of the Antarctic sabotaged by his angry deputy?
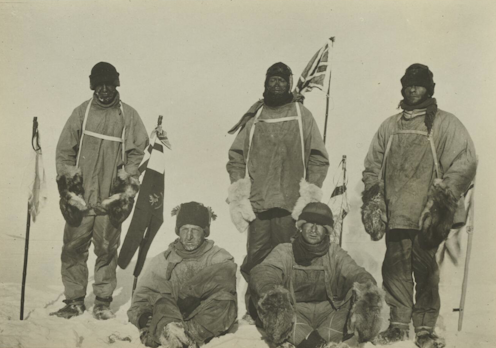 Scott and his team at the geographic South Pole, January 18, 1912. National Library of Australia
On February 11, 1913, the world woke to the headline “Death of Captain Scott. Lost with four comrades. The Pole reached. Disaster on the return”. A keenly anticipated, privately funded scientific venture “off the map” had turned to tragedy.
Previous reports had described the polar party of the British Antarctic Expedition striking out confidently just 2.5º latitude from their objective: the geographic South Pole. The journals and letters recovered from the bodies, however, told a tale of heartbreak and desperation: the explorers were shattered to find themselves beaten to the pole by Norwegian rival Roald Amundsen, and weakened terribly during their journey back to base.
Of the five men in Captain Robert F. Scott’s party, Petty Officer Edgar Evans was the first to die, while descending from the high-altitude Antarctic Plateau. Then, while searching in vain on the vast Ross Ice Shelf for the dog sleds ordered to speed their return to base, Captain Lawrence “Titus” Oates realised that his ever-slowing pace was threatening the others, and famously walked out into a blizzard with the parting words: “I am just going outside and may be some time.”
Pushing on with limited supplies, the remaining men (Scott, Dr Edward Wilson and Henry “Birdie” Bowers) found themselves trapped by a nine-day blizzard. All three wrote messages to friends and loved ones while waiting, until eventually their food ran out on about March 29, 1912.
Why did they really die?Their deaths were put down to the fickleness of Antarctic weather, bad luck or, most controversially, poor leadership on the part of Scott.
But my new research, published in the journal Polar Record, has uncovered new evidence about this ill-fated journey. I have identified major contradictions in the testimony of Scott’s second-in-command, Lieutenant Edward “Teddy” Evans, who survived the expedition after being rejected from Scott’s party.
Was Scott scuppered by Evans?Evans’s actions raise the possibility that he played a role in the deaths of the five men. Furious at not being included in the attempt on the pole, Evans was returning to base when he collapsed with scurvy. Evans was the only expedition member to develop scurvy, most probably due to his refusal to eat fresh seal meat, a known preventive measure.
His companions Tom Crean and William Lashly heroically saved Evans’s life, a tale made famous in no small measure by expeditioner Apsley Cherry-Garrard’s classic book on the expedition, The Worst Journey in the World.
Foul play over food?Buried in the British Library, I found a crucial piece of evidence about Evans’s trip back to camp. Seven pages of notes detail meetings held in April 1913 between Lord Curzon, president of the Royal Geographical Society, and Scott’s and Wilson’s widows, both of whom had read their late husbands’ diaries and correspondence.
According to the notes, Kathleen Scott reported that:
Scott’s words in his diary on exhaustion of food & fuel in depots on his return… It appears Lieut Evans – down with Scurvy – and the 2 men with him must on return journey have entered & consumed more than their share.
Several days later, also according to the meeting notes, Oriana Wilson described how:
…there was a passage in her husband’s diary which spoke of the “inexplicable” shortage of fuel & pemmican [sledging ration] on the return journey… This passage however she proposes to show to no one and to keep secret.
Closer examination of diary entries suggest that the food in question went missing from a depot at the southern end of the Ross Ice Shelf. Letters from the time indicate that Curzon immediately shut down the inquiry he was planning to hold. It is not unreasonable to assume that Curzon’s interpretation of events was that Evans was dangerously ill and if he had not taken the food would have also died.
But the account of exactly when Evans fell down with scurvy changed over time. Returning to civilisation in 1912, Evans described in a letter how he was stricken when he was 300 miles from base, a distance confirmed by media interviews from the time.
But by the following year, this figure had changed to 500 miles, a distance also reported in the book Scott’s Last Expedition. This would put the onset of his sickness at the southern end of the Ross Ice Shelf, precisely where the food appears to have gone missing.
Unwittingly, Cherry-Garrard published a substantially embellished version of Lashly’s sledging diary in The Worst Journey in the World, in which Evans’s sickness was shifted one week earlier to align with the public timeline.
Overall, the evidence strongly suggests that Evans took the cached food when he had not yet succumbed to scurvy, possibly because of his anger at having been sent back early and forced to drag his sledge with just two men. The timing of the various pieces evidence suggest that his story was later changed to fit with the idea that he took the food because he was ill.
Disturbingly, Scott’s order to Evans to send the dog sled teams to the southern end of the Ross Ice Shelf does not appear to have been communicated either, fatally slowing the polar party’s return.
Writing from his deathbed, Scott warned: “Teddy Evans is not to be trusted over much, though he means well.”
Given the evidence, this was arguably a generous statement.
Chris Turney receives funding from the Australian Research Council. He is the author of 'Iced In: Ten Days Trapped on the Edge of Antarctica' (published by Citadel), 'Shackled' (Penguin Books Australia) and '1912: The Year The World Discovered Antarctica' (Text Publishing).
The reality of living with 50℃ temperatures in our major cities
 Sydney is facing 50℃ summer days by 2040, new research says. Andy/Flickr/Wikimedia Commons, CC BY-SA
Australia is hot. But future extreme hot weather will be worse still, with new research predicting that Sydney and Melbourne are on course for 50℃ summer days by the 2040s if high greenhouse emissions continue. That means that places such as Perth, Adelaide and various regional towns could conceivably hit that mark even sooner.
This trend is worrying, but not particularly surprising given the fact that Australia is setting hot weather records at 12 times the pace of cold ones. But it does call for an urgent response.
Most of us are used to hot weather, but temperatures of 50℃ present unprecedented challenges to our health, work, transport habits, leisure and exercise.
Read more: Health Check: how to exercise safely in the heat
Humans have an upper limit to heat tolerance, beyond which we suffer heat stress and even death. Death rates do climb on extremely cold days, but increase much more steeply on extremely hot ones. While cold weather can be tackled with warm clothes, avoiding heat stress requires access to fans or air conditioning, which is not always available.
 The death rate in heat ramps up more rapidly than in cold.
Data from Li et al., Sci. Rep. (2016); Baccini et al., Epidemiol. (2008); McMichael et al., Int. J. Epidemiol. (2008), Author provided
The death rate in heat ramps up more rapidly than in cold.
Data from Li et al., Sci. Rep. (2016); Baccini et al., Epidemiol. (2008); McMichael et al., Int. J. Epidemiol. (2008), Author provided
Even with air conditioning, simply staying indoors is not necessarily an option. People must venture outside to commute and shop. Many essential services have to be done in the open air, such as essential services and maintaining public infrastructure.
Roughly 80% of the energy produced during muscular activity is heat, which must be dissipated to the environment, largely through perspiration. This process is far less effective in hot and humid conditions, and as a result the body’s core temperature begins to climb.
We can cope with increased temperatures for short periods – up to about half an hour – particularly those people who are fit, well hydrated and used to hot conditions. But if body temperature breaches 40-42℃ for an extended time, heat stress and death are likely. In hot enough weather, even going for a walk can be deadly.
Air conditioning may not save livesWe expect air conditioning to take the strain, but may not realise just how much strain is involved. Shade temperatures of 50℃ mean that direct sunlight can raise the temperature to 60℃ or 70℃. Bringing that back to a comfortable 22℃ or even a warm 27℃ is not always possible and requires a lot of energy – putting serious strain on the electricity grid.
Electricity transmission systems are inherently vulnerable to extreme heat. This means they can potentially fail simply due to the weather, let alone the increased demand on the grid from power consumers.
Power cuts can cause chaos, including the disruption to traffic signals on roads that may already be made less safe as their surfaces soften in the heat. Interruptions to essential services such as power and transport hamper access to lifesaving health care.
Myopic planningIt’s a dangerous game to use past extremes as a benchmark when planning for the future. The new research shows that our climate future will be very different from the past.
Melbourne’s 2014 heatwave triggered a surge in demand for ambulances that greatly exceeded the number available. Many of those in distress waited hours for help, and the death toll was estimated at 203.
Just last month, parts of New South Wales and Victoria experienced temperatures 16 degrees warmer than the September average, and 2017 is tracking as the world’s second-warmest year on record.
Preparing ourselvesLast year, the Australian Summit on Extreme Heat and Health warned that the health sector is underprepared to face existing heat extremes.
The health sector is concerned about Australia’s slow progress and is responding with the launch of a national strategy for climate, health and well-being. Reinstating climate and health research, health workforce training and health promotion are key recommendations.
There is much more to be done, and the prospect of major cities sweltering through 50℃ days escalates the urgency.
Read more: Climate policy needs a new lens: health and well-being
Two key messages arise from this. The first is that Australia urgently needs to adapt to the extra warming. Heat-wise communities (or “heat-safe communities” in some states) – where people understand the risks, protect themselves and look after each other – are vital to limit harm from heat exposure. The health sector must have the resources to respond to those who succumb. Research, training and health promotion are central.
The second message is that nations across the world need to improve their efforts to reduce greenhouse emissions, so as to meet the Paris climate goal of holding global warming to 1.5℃.
If we can do that, we can stave off some of the worst impacts. We have been warned.
Dr Liz Hanna has received funding from the National Health and Medical Research Council to study health effects of climate change - heat. She is immediate Past President of the Climate and Health Alliance.
The government's new gas deal will ease the squeeze, but dodges the price issue
 The government has so far refrained from putting a legal limit on LNG leaving our shores. Ken Hodges/Wikimedia Commons, CC BY
.jpg)
The deal signed this week by the federal government and the nation’s biggest three gas producers will ease Australia’s gas supply squeeze, but it will do nothing to address the current high prices.
Under the contract, Shell, Origin and Santos have agreed to supply more domestic gas to avert the predicted shortfall for 2018.
In so doing, the government seemingly sidestepped the need to trigger its own powers to forcibly restrict gas exports.
Sighs of relief all round, then. But here’s the thing: neither the new deal, nor the legislation that governs export controls, actually addresses the issue that is arguably most important to consumers – the high prices Australians are paying for their gas.
Read more: To avoid crisis, the gas market needs a steady steer, not an emergency swerve
Australia has vast gas resources, and yet somehow we find ourselves with rising prices and a forecast shortfall of up to one-sixth of demand in the east coast gas market in 2018.
This is partly understandable, given that rising global demand has fuelled a lucrative export market. The primary destination is Asia, which will assume more than 70% of global demand. In geographical terms this puts Australian exporters in a very strong position, and by 2019 Australia is forecast to supply 20% of the global market – up from 9% today.
However, the strong global demand for liquefied natural gas (LNG) does not in itself provide the full explanation for rising gas prices in Australia’s east coast gas market. This is caused by a weak regulatory environment.
Policy leversThe Australian Domestic Gas Security Mechanism, which took effect in July 2017, gives the federal resources minister the power to restrict exports of LNG in the event of a forecast shortfall for the domestic market in any given year.
This five-year provision was designed as a short-term measure to ensure domestic gas supply. If triggered, it would require LNG exporters either to limit their exports or to find new sources of gas to offset the impact on the domestic market.
To trigger the mechanism, the minister must follow three steps:
formally declare that the forthcoming year has a domestic shortfall, by October 1 of the preceding year;
consult relevant market bodies, government agencies, industry bodies and other stakeholders to determine their view on the existing and forecast market conditions; and
make a determination by November 1 on whether to implement the measures.
Any export restriction implemented under the ADGSM would potentially apply to all LNG exports nationwide, including those from areas with no forecast gas shortage, such as Western Australia. The minister does have the ability to determine the type of export restriction that is imposed. An unlimited volume restriction does not impose a specific volumetric limitation and can be applied to LNG projects that are not connected to the market experiencing the shortfall. A limited volume restriction imposes specific limits on the amount of LNG that may be exported and may be applied to an LNG project that is connected to the market experiencing the shortfall.
Non-compliance with the export limits imposed on gas projects would have a range of potential consequences for gas companies. These include revocation of export licence, imposition of different conditions, or stricter transparency requirements.
The new dealThe agreement signed with the big three gas producers effectively relieves the government of the need to consider triggering the ADGSM. As such, 2018 has not been officially declared to be a domestic shortfall year.
But the agreement is not grounded upon any specific legislative provision. Therefore it is essentially only enforceable against the gas companies that are parties to it. And in accordance with the private terms and conditions that those companies agree to.
The broad agreement is that contractors will sell a minimum of 54 petajoules of gas into the east coast domestic market (the lower limit of the forecast shortfall) and keep more on standby in case the eventual shortfall turns out to be bigger.
But what about prices?The deal contains no specific provision regarding domestic pricing. So, although there will be more gas in the domestic market, this does not necessarily mean that the current high prices will drop.
In the short term, the provision of additional supply may curtail dramatic increases in domestic gas prices. However, the gas deal does not address the core problem, which stems from our enormous commitment to LNG exports and the connection of domestic gas prices to the global energy market.
Indeed, the commitments are so great that many LNG operators have had to take conventional gas from South Australia and Victoria to fulfil their export contracts. This has put significant pressure on domestic prices.
The unequivocal truth is that gas prices were much cheaper before the LNG export boom. The only way to achieve some level of protection for domestic gas prices is to implement stronger regulatory controls on the export market. This should involve taking account of the public interest when assessing whether export restrictions should be imposed.
The ADGSM legislation does not incorporate any explicit public interest test, despite the fact that gas is a public resource in Australia and gas pricing is a strong public interest issue.
Compare that with the United States, where public interest is a key principle in assessing whether to approve any LNG exports to countries with no US free trade agreement (such as Japan). Public interest tests in the United States involve a careful determination of how exports will affect domestic supply and the potential impact that a strong export market will have upon domestic prices.
Read more: Want to boost the domestic gas industry? Put a price on carbon
The Australian government’s decision to broker a deal with gas suppliers, rather than extend the long arm of the law, means that regulators will need to keep a close eye on the gas companies to check that they are holding up their end of the bargain.
That job will fall to the Australian Competition and Consumer Commission (ACCC). ACCC chair Rod Simms this week warned gas suppliers to ensure that their “retail margins are appropriate”.
In the absence of any explicit rules compelling gas producers that signed the deal to provide clear and accurate information and adopt stronger transparency protocols, the ACCC may face a very onerous task.
Samantha Hepburn does not work for, consult, own shares in or receive funding from any company or organization that would benefit from this article, and has disclosed no relevant affiliations beyond the academic appointment above.
Europe will benefit hugely from keeping global warming to 1.5°C
From heatwaves to intense rainfall and severe cold weather, Europe experiences its fair share of weather extremes.
In an open access study, published in Environmental Research Letters, David Karoly and I have found that without limiting global warming, Europe is likely to see even more severe heat, less frequent extreme cold, and more intense rain events.
The Paris Agreement of December 2015 aims to limit the global temperature increase to “well below 2℃ above pre-industrial levels and to pursue efforts to limit the temperature increase to 1.5℃”, so as to “significantly reduce the risks and impacts of climate change”.
Read more: What is a pre-industrial climate and why does it matter?
Our analysis compares temperature and rainfall extremes under the 1.5℃ and 2℃ levels of global warming, with these same events in the current climate (with global warming of just over 1℃) and a pre-industrial climate.
Hotter, and more frequent, heat extremesAs the world warms up, so does Europe, although more in the Mediterranean and the east and less over Scandinavia and the British Isles.
We studied changes in a few different heat events, including hot summers like the record of 2003 in Central Europe. A blocking high pressure pattern led to persistent sunny hot weather across much of the continent, which dried out the region and enhanced the heat. Temperature records tumbled across the continent, with new national records for daily maximum temperatures in France, the UK and other countries. Previous work has already found a clear human fingerprint in both the event itself and the excess deaths associated with the heat.
Our study projects hot summers like 2003 will become more frequent at 1.5℃ and 2℃ of global warming. At 2℃ of global warming, Central European hot summers like 2003 would very likely occur in most years.
 Hot European summers like 2003 become more frequent at higher levels of global warming. Bars show best estimates of the chance of an event per year, with the black lines showing 90% confidence intervals.
Author provided
Hot European summers like 2003 become more frequent at higher levels of global warming. Bars show best estimates of the chance of an event per year, with the black lines showing 90% confidence intervals.
Author provided
We also find an increasing likelihood of events like the recent record hot year in Europe in 2016 and the record hot year in Central England in 2014 under the Paris Agreement’s targeted levels of global warming.
… But fewer, and less intense, cold extremesThe December of 2010 was exceptionally cold across the British Isles, as a lack of weather systems crossing the Atlantic allowed air from the north and the east to frequently cross the region. There was a new cold temperature record for Northern Ireland and persistent cold weather across the UK and Ireland, with long runs of sub-zero days. Heavy snowfall caused widespread disruption for days at a time.
 A snowy scene at Worcester Cathedral in December 2010.
David King
A snowy scene at Worcester Cathedral in December 2010.
David King
Our analysis finds that such a cold December was already very unlikely to occur in the current climate, and would be extremely unlikely under either 1.5℃ or 2℃ of global warming. Future cold weather events would still be associated with similar weather patterns, but the background warming in the climate system would make them less intense than in the world of today or under pre-industrial conditions.
When it rains, it poursWe also studied extreme rain events, in particular the heavy rain that led to large-scale flooding in England and Wales in May, June and July of 2007. Low pressure systems passed over the British Isles almost continually for that three-month period, so the rain was falling on already saturated ground. On July 19 and 20 more than 100mm of rain fell on a broad swathe of the English Midlands. This record-breaking rainfall resulted in some of the worst floods in British history.
 The River Teme near Worcester, England in flood in July 2007.
David King
The River Teme near Worcester, England in flood in July 2007.
David King
Extended rainy periods like May-July 2007 are very rare, and not projected to become more frequent at 1.5℃ or 2℃ of global warming.
However, extreme rainfall days like we saw during that period are projected to become both more frequent and more intense in a warmer world. In a 2℃ world we would expect very heavy rain days to be at least 70% more frequent than in the current climate over the UK and Ireland.
Clear benefits to keeping a lid on global warmingMany of the most costly extreme weather events in Europe, in particular extreme heat and intense rainfall events, are projected to become more common, even at the relatively low levels of global warming that are being targeted under the Paris Agreement.
 More frequent heat extremes expected as the globe warms up. Best estimates of the likelihood of extreme events are shown (with 90% confidence intervals in parentheses). T means average temperature and R means total rainfall. TXx and TNn mean the hottest daily maximum and coldest daily minimum, respectively, while Rx1day means the wettest single day.
Author provided
More frequent heat extremes expected as the globe warms up. Best estimates of the likelihood of extreme events are shown (with 90% confidence intervals in parentheses). T means average temperature and R means total rainfall. TXx and TNn mean the hottest daily maximum and coldest daily minimum, respectively, while Rx1day means the wettest single day.
Author provided
The worst impacts of these events can be avoided through improving the planning and responses for such events, whether it is increasing support for the elderly in France during summer heatwaves or improving flood protection on major rivers in Britain.
However, limiting global warming to 1.5℃, rather than 2℃ or more, would reduce the frequency with which these extreme event responses would need to be implemented.
Put simply, to prevent a more extreme future for Europe’s weather, we need to keep the lid on global warming.
Andrew King receives funding from the ARC Centre of Excellence for Climate System Science.
The oil and gas sector needs to diversify if it wants to prosper
 Business as usual is not an option. CSIRO/Wikimedia Commons, CC BY
One does not have to look far to see signs that the oil and gas industry has a bumpy road ahead. Demand might stay high for decades, but given the dizzying pace of technological change, who would bet on that?
Take the recent pledges by India, France, Britain, and China to phase out petrol and diesel vehicles. Or the plummeting costs of grid-scale solar power, rapidly becoming cheaper than fossil-fuelled electricity.
These developments should cause oil and gas companies to think very carefully about their next move. Big investments in natural gas globally, made on the assumption that gas is a bridge to a clean energy future, may fall flat because renewables are developing so swiftly.
The fact of the matter is that oil and gas companies need to start planning for a low-carbon future and embrace the opportunities it presents. One approach is to diversify their products and embrace renewable energy, one of four strategies that CSIRO has identified in its industry-led Oil and Gas Roadmap that outlines some of the future directions the industry might take.
Read more: Big oil’s offshore scramble is risky business all round
With 40% of companies involved in the exploration and production of petroleum likely to move away from oil and gas in 2017, solar photovoltaics and energy storage offer alternative avenues in which oil and gas companies can invest.
Renewables can be integrated into operations to reduce both the cost and the carbon intensity of operations. In the longer term, these technologies could help energy companies to develop more sophisticated offerings. For instance, hybrid solar and gas microgrids could be sold to developing nations, allowing them to leapfrog from energy poverty into clean, cheap distributed energy for all, effectively skipping expensive, centralised electricity grid infrastructure.
The Oil and Gas roadmap. Gas-powered shipsTwo more strategic opportunities focus on expanding the potential of the least carbon-intensive fossil fuel: natural gas.
For example, global demand for liquefied natural gas (LNG) for transport is expected to grow fourfold to 100 million tonnes a year by 2030, a prime target being maritime shipping. Meeting this LNG demand could open up a valuable market for Australia.
Another opportunity lies in the creation of higher-value products. Natural gas can be converted to many refined products that can fetch higher margins in the market, including diesel and other chemicals such as methanol and dimethyl ether.
More investment is needed to make conversion technology economically competitive, but it would be a wise investment, especially in light of Australia’s lack of domestic strategic fuel reserves.
Read more: Running on empty: Australia’s risky approach to oil supplies
Hydrogen fuel is another possibility for Australian resource companies. It can be produced from gas, but in the future hydrogen fuel could also be manufactured by solar-powered electrolysis of water. Both would be good options, given Australia’s abundance of gas and sunlight.
Investments will be needed to improve the production and transport economics of hydrogen, including the development of efficient technologies that can convert hydrogen carriers (like ammonia) to hydrogen at the point of use.
 Smarter fuel options.
CSIRO, Author provided
Smarter fuel options.
CSIRO, Author provided
Our roadmap also suggests other ways for companies to get involved in the energy transition, by becoming more efficient, less wasteful, and more productive.
Advanced environmental solutions point to ways to improve water quality and reuse, reduce or eliminate greenhouse gas emissions (including sequestering carbon dioxide, controlling fugitive emissions, and finding alternatives to flaring), and finding the best ways to decommission assets like wells and offshore platforms after their useful life is over.
The industry needs to be much more efficient in exploring and producing oil and gas so that the life of existing assets can be lengthened, often using less environmentally damaging approaches such as waterless fracturing and reservoir rejuvenation using microbes. Robots and artificial intelligence could also help to improve efficiency and safety.
The oil and gas sector has an important role to play in the future of the energy sector, but that role is changing. Companies need to be proactive to remain relevant. If they pursue some of the opportunities outlined here, they will help ensure they stay viable into the future.
Jerad A. Ford has previously received research funding and scholarships from the UQ Centre for Coal Seam Gas while a student and post-doc researcher at the University of Queensland Business School.
Australia's $1 billion loan to Adani is ripe for a High Court challenge
Indian mining giant Adani’s proposal to build Australia’s largest coal mine in Queensland’s Galilee Basin has been the source of sharp national controversy, because of its potential economic, health, environmental and cultural risks.
These concerns were amplified this week when India’s former environment minister Jairam Ramesh told the ABC’s Four Corners:
My message to the Australian government would certainly be: please demonstrate that you have done more homework than has been the case so far.
It’s a valid warning, considering that a Commonwealth investment board is considering loaning Adani A$1 billion in federal money to assist the development of mining infrastructure.
Read more: Adani gives itself the green light, but that doesn’t change the economics of coal
The loan, expected to be announced any day now, will no doubt agitate further political controversy.
It is also likely to pave the way for yet more court challenges against Adani’s proposal.
Why does Adani want Commonwealth money?One of the major questions about Adani’s mine is its financial viability, and its inability to secure private sector funding. Its proponents blame anti-coal campaigners, but arguably more important are the myriad concerns about Adani’s liquidity, its corporate structure and conduct, and the ever-weakening international coal market.
Against this backdrop Adani has requested A$1 billion from the Northern Australia Infrastructure Facility (NAIF), a A$5 billion discretionary government fund set up in 2015 to promote economic development in the country’s north.
The timing and geographical focus of the fund have raised fears it is just a government “slush fund”, set up with Adani’s plans specifically in mind. The federal government initially denied this, with Energy Minister Josh Frydenberg stressing that the mine “needs to stand on its own two feet”.
But shortly after the NAIF Act was passed, Adani’s application was made public, although there remains little available detail about whether or why it will be given the money, or the exact amount.
Loan proceduresNAIF’s board will make the decision, not a government minister. Its processes are shielded from scrutiny by a lack of transparency requirements and consistent blocking of Freedom of Information requests.
As the loan decisions are made by a quasi-corporate board, rather than a minister, it is much harder (if not impossible) to challenge them directly in court. Nor does the NAIF Act provide grounds for review or appeal.
Ultimately, this leaves those who object to Adani receiving Commonwealth money with a very limited avenue of legal challenge. The only option is to argue that the NAIF Act is itself unconstitutional.
Constitutional challengeThe Commonwealth has no direct power to make laws that control or support infrastructure or mining directly. Instead, the NAIF Act seeks to do this indirectly using Section 96 of the Constitution, which states:
During a period of ten years after the establishment of the Commonwealth and thereafter until the Parliament otherwise provides, the Parliament may grant financial assistance to any State on such terms and conditions as the Parliament thinks fit. (emphasis added)
There are two points to note here.
The first is that this granting provision was clearly meant as a transitional measure for the decade immediately following federation, to protect poorer states from bankruptcy while adjusting their economies to a federal model. Note also that the provision was clearly intended to help state governments, not corporations.
The second is the phrase “terms and conditions”, which clearly relates to the repayment of these loans, much like the terms and conditions applied to any banking loan today.
Both of these things were ignored by the early (and somewhat infamous) Engineers High Court from the 1920s to 1950s, which tended to interpret the Constitution in a way that favoured the Commonwealth over the states.
Perhaps most importantly, the court ruled that Section 96 allows the Commonwealth to apply any terms and conditions it likes to the loans, rather than simply setting the terms of repayment. That has meant that states can be compelled to take particular actions – such as accepting national educational standards, building roads or, indeed, infrastructure development – in return for financial assistance. States were also forced to stop collecting income tax in return for federal monies. This resulted in a “vertical fiscal imbalance” which has left the states at the financial mercy of the Commonwealth ever since.
This extremely liberal interpretation of Section 96 has not been legally challenged since the early days of the federation, not least because recipients or potential recipients of money are unlikely to bite the hand that feeds them. But the Adani loan might just change this.
 Critics of the use of Section 96 have long hoped for a High Court challenge to its ever-growing use to expand Commonwealth financial influence. The Adani loan may be the right vehicle.
Thennicke/Wikicommons
Critics of the use of Section 96 have long hoped for a High Court challenge to its ever-growing use to expand Commonwealth financial influence. The Adani loan may be the right vehicle.
Thennicke/Wikicommons
Adani’s prospective loan seems clearly inconsistent with the wording of Section 96. Any constitutional challenge against it is likely to be complex and nuanced, but two basic arguments present themselves.
First, the Constitution states that it is the Commonwealth Parliament that must determine both the loan and its conditions. However, the NAIF Act grants these powers to a corporate board, which answers only indirectly to the Parliament.
Second, the Constitution states that it is the state that must receive the loan. But the Queensland Government has stated that it will simply pass the NAIF funding straight to Adani, and that:
Commonwealth’s borrowings for the NAIF project will remain on the Commonwealth’s balance sheet and not on Queensland’s.
This is a highly questionable use of a federal power that was conceived as a way to help states with their financing, rather than private multinational companies.
Note also the apparent bypassing of the Senate in this process. Senators may be likely to bring a legal challenge if they feel that federal money meant to benefit their states is being distributed improperly.
More than just federal money at stakeWhile it is impossible to second-guess the High Court on such a complex matter, its recent decisions indicate a major swing away from unsupervised Commonwealth spending, especially on issues that affect the fiscal balance between the states and Commonwealth. The potential Adani loan certainly seems to fall into that category.
Read more: Why are we still pursuing the Adani Carmichael mine?
Yet as much as Section 96 has been stretched beyond its original intention, it has also been used to support vital and important national enterprises, from education, to social welfare, and indeed national development projects.
With that in mind, the Commonwealth might ultimately come to doubt the wisdom of granting such a vast sum of money to a questionable company. If it leads to more restrictive reading of Section 96 by the High Court, it might significantly limit Canberra’s ability to fund valuable schemes in other areas.
Brendan Gogarty is has provided pro bono (free) legal advice to the Australian Conversation Foundation on the constitutionality of the proposed Adani Loan. The advice was provided in a voluntary capacity in his role as a community legal practitioner.
Why are we still pursuing the Adani Carmichael mine?
Why, if Adani’s gigantic Carmichael coal project is so on-the-nose for the banks and so environmentally destructive, are the federal and Queensland governments so avid in their support of it?
Once again the absurdity of building the world’s biggest new thermal coal mine was put in stark relief on Monday evening via an ABC Four Corners investigation, Digging into Adani.
Read more: Adani gives itself the green light, but that doesn’t change the economics of coal
Where the ABC broke new ground was in exposing the sheer breadth of corruption by this Indian energy conglomerate. And its power too. The TV crew was detained and questioned in an Indian hotel for five hours by police.
It has long been the subject of high controversy that the Australian government, via the Northern Australia Infrastructure Facility (NAIF)that is still contemplating a A$1 billion subsidy for Adani’s rail line, a proposal to freight the coal from the Galilee Basin to Adani’s port at Abbot Point on the Great Barrier Reef.
But more alarming still, and Four Corners touched on this, is that the federal government is also considering using taxpayer money to finance the mine itself, not just the railway.
No investors in sightAs private banks have walked away from the project, the only way Carmichael can get finance is with the government providing guarantees to a private banking syndicate, effectively putting taxpayers on the hook for billions of dollars in project finance.
The prospect is met with the same incredulity in India as it is here in Australia:
FOUR CORNERS: “Watching on from Delhi, India’s former Environment Minister can’t believe what he is seeing.”
JAIRAM RAMESH: “Ultimately, it’s the sovereign decision of the Australian Government, the federal government and the state government.
FOUR CORNERS: "But public money is involved, and more than public money, natural resources are involved.
JAIRAM RAMESH: "I’m very, very surprised that the Australian government, uh, for whatever reason, uh, has uh, seen it fit, uh, to all along handhold Mr Adani.”
Here we have a project that does not stack up financially, and whose profits - should it make any - are destined for tax haven entities controlled privately by Adani family interests. Yet the Queensland government has shocked local farmers and environmentalists by gifting Adani extremely generous water rights, and royalties concessions to boot.
Why are Australian governments still in support?The most plausible explanation is simply politics and political donations. There is no real-time disclosure of donations and it is relatively easy to disguise them, as there is no disclosure of the financial accounts of state and federal political parties either. Payments can be routed through opaque foundations, the various state organisations, and other vehicles.
Many Adani observers believe there must be money involved, so strident is the support for so unfeasible a project. The rich track record of Adani bribing officials in India, as detailed by Four Corners, certainly points that way. But there is little evidence of it.
In the absence of proof of any significant financial incentives however, the most compelling explanation is that neither of the major parties is prepared to be “wedged” on jobs, accused of being anti-business or anti-Queensand.
There are votes in Queensland’s north at stake. Furthermore, the fingerprints of Adani’s lobbyists are everywhere.
Adani lobbyist and Bill Shorten’s former chief of staff Cameron Milner helped run the re-election campaign of Premier Annastacia Palaszczuk. This support, according to The Australian, has been given free of charge:
Mr Milner is volunteering with the ALP while keeping his day job as director and registered lobbyist at Next Level Strategic Services, which counts among its clients Indian miner Adani…
The former ALP state secretary held meetings in April and May with Ms Palaszczuk and her chief of staff David Barbagallo to negotiate a government royalties deal for Adani, after a cabinet factional revolt threatened the state’s largest mining project.
Adani therefore enjoys support and influence on both sides of politics. “Next Level Strategic Services co-director David Moore — an LNP stalwart who was Mr Newman’s chief of staff during his successful 2012 election campaign — is also expected to volunteer with the LNP campaign.”
So it is that Premier Palaszczuk persists with discredited claims that Carmichael will produce 10,000 jobs when Adani itself conceded in a court case two years ago the real jobs number would be but a fraction of that.
If the economics don’t stack up, why is Adani still pursuing the project?The Adani group totes an enormous debt load, the seaborne thermal coal market is in structural decline as new solar capacity is now cheaper to build than new coal-fired power plants and the the government of India is committed to phasing out coal imports in the next three years.
Why flood the market with 60 million tonnes a year in new supply and further depress the price of one of this country’s key export commodities?
The answer to this question lies in the byzantine structure of the Adani companies themselves. Adani already owns the terminal at Abbot Point and it needs throughput to make it financially viable.
Both the financial structures behind the port and the proposed railway are ultimately controlled in tax havens: the Cayman Islands, the British Virgin Islands and Singapore. Even if Adani Mining and its related Indian entities upstream, Adani Enterprises and Adani Power, lose money on Carmichael, the Adani family would still benefit.
Read more: Australia’s $1 billion loan to Adani is ripe for High Court challenge
The port and rail facilities merely “clip the ticket” on the volume of coal which goes through them. The Adani family then still profits from the privately-controlled infrastructure, via tax havens, while shareholders on the Indian share market shoulder the likely losses from the project.
As the man who used to be India’s most powerful energy bureaucrat, E.A.S. Sharma, told the ABC: “My assessment is that by the time the Adani coal leaves the Australian coast the cost of it will be roughly about A$90 per tonne.
"We cannot afford that, it is so expensive.”
More questions than answers remainThis renders the whole project even more bizarre. Why would the government put Australian taxpayers on the hook for a project likely to lose billions of dollars when the only clear beneficiaries are the family of Indian billionaire Gautam Adani and his Caribbean tax havens.
My view is that this project is a white elephant and will not proceed. Given the commitment by our elected leaders however, it may be that some huge holes in the earth may still be dug before it falls apart.
Michael West does not work for, consult, own shares in or receive funding from any company or organisation that would benefit from this article, and has disclosed no relevant affiliations beyond the academic appointment above.
Australian household electricity prices may be 25% higher than official reports
The International Energy Agency (IEA) may be underestimating Australian household energy bills by 25% because of a lack of accurate data from the federal government.
The Paris-based IEA produces official quarterly energy statistics for the 30 member nations of the Organisation for Economic Cooperation and Development (OECD), on which policymakers and researchers rely heavily. But to provide this service, the IEA relies on member countries to provide it with good-quality data.
Last month, the agency published its annual summary report, Key World Statistics, which reported that Australian households have the 11th most expensive electricity prices in the OECD.
Read more: FactCheck: Are Australians paying twice as much for electricity as Americans?
But other studies – notably the Thwaites report into Victorian energy prices – have reported that households are typically paying significantly more than the official estimates. In fact, if South Australia were a country it would have the highest energy prices in the OECD, and typical households in New South Wales, Queensland or Victoria would be in the top five.
A spokesperson for the federal Department of Environment and Energy, the agency responsible for providing electricity price data to the IEA, told The Conversation:
Household electricity prices data for Australia are sourced from the Australian Energy Market Commission annual Residential electricity price trends report. The national average price is used, with GST added. It is a weighted average based on the number of household connections in each jurisdiction.
The Australian energy statistics are the basis for the Australia data reported by the IEA in their Key world energy statistics. The Department of the Environment and Energy submits the data to the IEA each September. Some adjustments are made to the AES data to conform with IEA reporting requirements.
But it is clear that the electricity price data for Australia published by the IEA is at least occasionally of poor quality.
The Australian household electricity series in the IEA’s authoritative Energy Prices and Taxes quarterly statistical report stopped in 2004, and only resumed again again in 2012.
Between 2012 and 2016, the IEA’s reported residential price series data for Australia showed no change in prices.
Yet the Australian Bureau of Statistics’ electricity price index, which is based on customer surveys, showed a roughly 20% increase in the All Australia electricity price index over this period.
Australia is also the only OECD nation not to report electricity prices paid by industry.
Current pricesThis year’s reported household average electricity prices are almost certainly wrong too. The IEA reports that household electricity prices in Australia for the first quarter of 2017 were US20.2c per kWh.
At a market exchange rate of US79c to the Australian dollar, this puts Australian household electricity prices at AU28c per kWh. Adjusted for the purchasing power of each currency, the comparable price is AU29c per kWh.
By contrast, the independent review of the Victorian energy sector chaired by John Thwaites surveyed the real energy prices paid by customers, as evidenced by their bills. In a sample of 686 Victorian households, those with energy consumption close to the median value were paying an average of AU35c per kWh in the first quarter of 2017. This is 25% more than the IEA’s official estimate. At least part of this difference is explained by the AEMC’s assumption that all customers in a competitive retail market are supplied on their retailers’ cheapest offers. But this is not the case in reality.
Surveying real electricity and gas bills drastically reduces the range of assumptions that need to be made to estimate the price paid by a representative customer. Indeed, as long as the sample of bills is representative of the population, a survey based on actual bills produces a reliable estimate of representative prices in retail markets characterised by high levels of price dispersion, as Australia’s retail electricity markets are.
Read more: Baffled by baseload? Dumbfounded by dispatchables? Here’s a glossary of the energy debate
Pointing to a reliable estimate of Victoria’s representative residential price is, of course, not enough to prove that the IEA’s estimate is wrong. It could just as easily mean that Victorians are paying way more than the national average for their electricity.
But the idea that Victorians are paying more than average does not stack up when we look at the state-by-state data, which suggests that Victoria is actually somewhere in the middle. Judging by the prices charged by the three largest retailers in each state and territory, Victorian householders are paying about the same as those in New South Wales and Queensland, less than those in South Australia, and more than those in Tasmania, the Northern Territory, Western Australia and the Australian Capital Territory.
 Residential electricity prices.
Author provided
Residential electricity prices.
Author provided
The IEA can not reasonably be blamed for the inadequate residential data for Australia that they report, and the nonexistent data on electricity prices paid by Australia’s industrial customers. The IEA does not do its own calculation of prices in each country, but rather it relies on price estimates from official sources in those countries.
An obvious question that arises from this is where Australia really ranks internationally if we used prices that reflect what households are actually paying.
This is contentious, not least because prices in New South Wales, Queensland and South Australia increased – typically around 15% or more – from July this year. We do not know how prices have changed in other OECD member countries since the IEA’s recent publication (which covered prices for the first quarter of 2017). But we do know that prices in Australia have been far more volatile than in any other OECD country.
Assuming that other countries’ prices are roughly the same as they were in the first quarter of 2017, our estimate using the IEA’s data is that the typical household in South Australia is paying more than the typical household in any other OECD country. The typical household in New South Wales, Queensland or Victoria is paying a price that ranks in the top five.
It should also be remembered that these prices are after excise and sale tax. Taxes on electricity supply in Australia are low by OECD standards – so if we use pre-tax prices, Australian households move even higher up the list.
There are serious question marks over Australia’s official electricity price reporting. Policy makers, consumers and the public have a right to expect better.
Bruce Mountain is a cofounder of MarkIntell, which is owned and operated by Carbon and Energy Markets and provides energy retail market data (including data used in this article) for use by regulators and governments in Australia.
For whom the bell tolls: cats kill more than a million Australian birds every day
 On the prowl in the outback. Hugh McGregor/Arid Recovery, Author provided
Cats kill more than a million birds every day across Australia, according to our new estimate – the first robust attempt to quantify the problem on a nationwide scale.
By combining data on the cat population, hunting rates and spatial distribution, we calculate that they kill 377 million birds a year. Rates are highest in Australia’s dry interior, suggesting that feral cats pose a serious and largely unseen threat to native bird species.
Read more: Ferals, strays, pets: how to control the cats that are eating our wildlife
This has been a contentious issue for more than 100 years, since the spread of feral cats encompassed the entire Australian mainland. In 1906 the ornithologist A.J. Campbell noted that the arrival of feral cats in a location often immediately preceded the decline of many native bird species, and he campaigned vigorously for action:
Undoubtedly, if many of our highly interesting and beautiful birds, especially ground-loving species, are to be preserved from total extinction, we must as a bird-lovers’ union, at no distant date face squarely a wildcat destruction scheme.
His call produced little response, and there has been no successful and enduring reduction in cat numbers since. Nor, until now, has there been a concerted effort to find out exactly how many birds are being killed by cats.
Counting the costTo provide a first national assessment of the toll taken by cats on Australian birds, we have compiled almost 100 studies detailing the diets of Australia’s feral cats. The results show that the average feral cat eats about two birds every five days.
We then combined these statistics with information about the population density of feral cats, to create a map of the estimated rates of birds killed by cats throughout Australia.
 Number of birds eaten per square kilometre.
Brett Murphy, Author provided
Number of birds eaten per square kilometre.
Brett Murphy, Author provided
We conclude that, on average, feral cats in Australia’s largely natural landscapes kill 272 million birds per year. Bird-kill rates are highest in arid Australia (up to 330 birds per square km per year) and on islands, where rates can vary greatly depending on size.
We also estimate (albeit with fewer data) that feral cats in human-modified landscapes, such as the areas surrounding cities, kill a further 44 million birds each year. Pet cats, meanwhile, kill about 61 million birds per year.
Overall, this amounts to more than 377 million birds killed by cats per year in Australia – more than a million every day.
Which species are suffering?In a related study, we also compiled records of the bird species being killed by cats in Australia. We found records of cats killing more than 330 native bird species – about half of all Australia’s resident bird species. In natural and remote landscapes, 99% of the cat-killed birds are native species. Our results also show that cats are known to kill 71 of Australia’s 117 threatened bird species.
Birds that feed or nest on the ground, live on islands, and are medium-sized (60-300g) are most likely to be killed by cats.
 Galahs are among the many native species being killed by feral cats.
Mark Marathon, Author provided
Galahs are among the many native species being killed by feral cats.
Mark Marathon, Author provided
It is difficult to put a million-plus daily bird deaths in context without a reliable estimate of the total number of birds in Australia. But our coarse assessment from many published estimates of local bird density suggests that there are about 11 billion land birds in Australia, suggesting that cats kill about 3-4% of Australia’s birds each year.
However, particular species are hit much harder than others, and the population viability of some species (such as quail-thrushes, button-quails and ground-feeding pigeons and doves) is likely to be especially threatened.
Our tally of bird deaths is comparable to similar estimates for other countries. Our figure is lower than a recent estimate for the United States, and slightly higher than in Canada. Overall, bird killings by cats seem to greatly outnumber those caused by humans.
In Australia, cats are likely to significantly increase the extinction risk faced by some bird species. In many locations, birds face a range of interacting threats, with cat abundance and hunting success shown to increase in fragmented bushland, in areas with high stocking rates, and in places with poorly managed fire regimes, so cat impacts compound these other threats.
Belling the catWhat can be done to reduce the impact? The federal government’s Threatened Species Strategy recognises the threat posed by feral cats, albeit mainly on the basis of their role in mammal extinctions.
The threatened species strategy also prioritised efforts to control feral cats more intensively, eradicate them from islands with important biodiversity values, and to expand a national network of fenced areas that excludes feral cats and foxes.
But while fences can create important havens for many threatened mammals, they are much less effective for protecting birds. To save birds, cats will need to be controlled on a much broader scale.
Read more: The war on feral cats will need many different weapons
We should also remember that this is not just a remote bush problem. Roughly half of Australia’s cats are pets, and they also take a considerable toll on wildlife.
While recognising the many benefits of pet ownership, we should also work to reduce the detrimental impacts. Fortunately, there is increasing public awareness of the benefits of not letting pet cats roam freely. With such measures, cat owners can help to look after the birds in their own backyards, and hence contribute to conserving Australia’s unique wildlife.
We acknowledge the contribution of Russell Palmer (WA Department of Biodiversity Conservation and Attractions), Chris Dickman (University of Sydney), David Paton (University of Adelaide), Alex Nankivell (Nature Foundation SA Inc.), Mike Lawes (University of KwaZulu-Natal), and Glenn Edwards (Department of Environment and Natural Resources) to this article.
John Woinarski has received funding from the Australian government's National Environmental Science Programme (Threatened Speices Recovery Hub).
Brett Murphy has received funding from the Australian government's National Environmental Science Programme (Threatened Speices Recovery Hub).
Leigh-Ann Woolley has received funding from the Australian government's National Environmental Science Programme (Threatened Speices Recovery Hub).
Sarah Legge has received funding from the Australian government's National Environmental Science Programme (Threatened Speices Recovery Hub).
Stephen Garnett has received funding from the Australian government's National Environmental Science Programme (Threatened Speices Recovery Hub).
Tim Doherty receives funding from the Hermon Slade Foundation, Australian Academy of Sciences and Ecological Society of Australia. He is a board member of the Society for Conservation Biology Oceania and member of the Ecological Society of Australia and Australian Mammal Society.
Magpies can form friendships with people – here's how
Can one form a friendship with a magpie? –even when adult males are protecting their nests during the swooping season? The short answer is:“ Yes, one can” - although science has just begun to provide feasible explanations for friendship in animals, let alone for cross-species friendships between humans and wild birds.
Ravens and magpies are known to form powerful allegiances among themselves. In fact, Australia is thought to be a hotspot for cooperative behaviour in birds worldwide. They like to stick together with family and mates, in the good Australian way.
Read more: In defence of magpies: the bird world’s bad boy is simply misunderstood
Of course, many bird species may readily come to a feeding table and become tame enough to take food from our hand, but this isn’t really “friendship”. However, there is evidence that, remarkably, free-living magpies can forge lasting relationships with people, even without depending on us for food or shelter.
When magpies are permanently ensconced on human property, they are also far less likely to swoop the people who live there. Over 80% of all successfully breeding magpies live near human houses, which means the vast majority of people, in fact, never get swooped. And since magpies can live between 25 and 30 years and are territorial, they can develop lifelong friendships with humans. This bond can extend to trusting certain people around their offspring.
A key reason why friendships with magpies are possible is that we now know that magpies are able to recognise and remember individual human faces for many years. They can learn which nearby humans do not constitute a risk. They will remember someone who was good to them; equally, they remember negative encounters.
Why become friends?Magpies that actively form friendships with people make this investment (from their point of view) for good reason. Properties suitable for magpies are hard to come by and the competition is fierce. Most magpies will not secure a territory – let alone breed – until they are at least five years old. In fact, only about 14% of adult magpies ever succeed in breeding. And based on extensive magpie population research conducted by R. Carrick in the 1970s, even if they breed successfully every single year, they may successfully raise only seven to eleven chicks to adulthood and breeding in a lifetime. There is a lot at stake with every magpie clutch.
Read more: Bird-brained and brilliant: Australia’s avians are smarter than you think
The difference between simply not swooping someone and a real friendship manifests in several ways. When magpies have formed an attachment they will often show their trust, for example, by formally introducing their offspring. They may allow their chicks to play near people, not fly away when a resident human is approaching, and actually approach or roost near a human.
In rare cases, they may even join in human activity. For example, magpies have helped me garden by walking in parallel to my weeding activity and displacing soil as I did. One magpie always perched on my kitchen window sill, looking in and watching my every move.
 The curious magpie following the author’s movements in her home (Photo by G.Kaplan no reuse)
On one extraordinary occasion, an adult female magpie gingerly entered my house on foot, and hopped over to my desk where I was sitting. She watched me type on the keyboard and even looked at the screen. I had to get up to take a phone call and when I returned, the magpie had taken up a position at my keyboard, pecked the keys gently and then looked at the “results” on screen.
The bird was curious about everything I did. She also wanted to play with me and found my shoelaces particularly attractive, pulling them and then running away a little only to return for another go.
Importantly, it was the bird (not hand-raised but a free-living adult female) that had begun to take the initiative and had chosen to socially interact and such behaviour, as research has shown particularly in primates, is affiliative and part of the basis of social bonds and friendships.
Risky businessIf magpies can be so good with humans how can one explain their swooping at people (even if it is only for a few weeks in the year)? It’s worth bearing in mind that swooping magpies (invariably males on guard duty) do not act in aggression or anger but as nest defenders. The strategy they choose is based on risk assessment.
A risk is posed by someone who is unknown and was not present at the time of nest building, which unfortunately is often the case in public places and parks. That person is then classified as a territorial intruder and thus a potential risk to its brood. At this point the male guarding the brooding female is obliged to perform a warning swoop, literally asking a person to step away from the nest area.
If warnings are ignored, the adult male may try to conduct a near contact swoop aimed at the head (the magpie can break its own neck if it makes contact, so it is a strategy of last resort only). Magpie swooping is generally a defensive action taken when someone unknown approaches who the magpie believes intends harm. It is not an arbitrary attack.
 Fearless magpie in pursuit of larger and dangerous brown goshawk keeping themselves and other.
species safe (Photo by G Kaplan- no reuse)
When I was swooped for the first time in a public place I slowly walked over to the other side of the road. Importantly, I allowed the male to study my face and appearance from a safe distance so he could remember me in future, a useful strategy since we now know that magpies remember human faces. Taking a piece of mince or taking a wide berth around the magpies nest may eventually convince the nervous magpie that he does not need to deter this individual anymore because she or he poses little or no risk, and who knows, may even become a friend in future.
Fearless magpie in pursuit of larger and dangerous brown goshawk keeping themselves and other.
species safe (Photo by G Kaplan- no reuse)
When I was swooped for the first time in a public place I slowly walked over to the other side of the road. Importantly, I allowed the male to study my face and appearance from a safe distance so he could remember me in future, a useful strategy since we now know that magpies remember human faces. Taking a piece of mince or taking a wide berth around the magpies nest may eventually convince the nervous magpie that he does not need to deter this individual anymore because she or he poses little or no risk, and who knows, may even become a friend in future.
A sure way of escalating conflict is to fence them with an umbrella or any other device, or to run away at high speed. This human approach may well confirm for the magpie that the person concerned is dangerous and needs to be fought with every available strategy.
In dealing with magpies, as in global politics, de-escalating a perceived conflict is usually the best strategy.
Gisela Kaplan received funding from the ARC in the past for field research on free-ranging magpies .
How to work out which coral reefs will bleach, and which might be spared
Regional variations in sea surface temperature, related to seasons and El Niño, could be crucial for the survival of coral reefs, according to our new research. This suggests that we should be able to identify the reefs most at risk of mass bleaching, and those that are more likely to survive unscathed.
Healthy coral reefs support diverse ecosystems, hosting 25% of all marine fish species. They provide food, coastal protection and livelihoods for at least 500 million people.
But global warming, coupled with other pressures such as nutrient and sediment input, changes in sea level, waves, storms, ventilation, hydrodynamics, and ocean acidification, could lead to the end of the world’s coral reefs in a couple of decades.
Read more: How much coral has died in the Great Barrier Reef’s worst bleaching event?
Climate warming is the major cause of stress for corals. The world just witnessed an event described as the “longest global coral die-off on record”, and scientists have been raising the alarm about coral bleaching for decades.
The first global-scale mass bleaching event happened in 1998, destroying 16% of the world coral reefs. Unless greenhouse emissions are drastically reduced, the question is no longer if coral bleaching will happen again, but when and how often?
To help protect coral reefs and their ecosystems, effective management and conservation strategies are crucial. Our research shows that understanding the relationship between natural variations of sea temperature and human-driven ocean warming will help us identify the areas that are most at risk, and also those that are best placed to provide safe haven.
A recurrent threatBleaching happens when sea temperatures are unusually high, causing the corals to expel the coloured algae that live within their tissues. Without these algae, corals are unable to reproduce or to build their skeletons properly, and can ultimately die.
The two most devastating global mass bleaching events on record – in 1998 and 2016 – were both triggered by El Niño. But when water temperatures drop back to normal, corals can often recover.
Certain types of coral can also acclimatise to rising sea temperatures. But as our planet warms, periods of bleaching risk will become more frequent and more severe. As a consequence, corals will have less and less time to recover between bleaching events.
We are already witnessing a decline in coral reefs. Global populations have declined by 1-2% per year in response to repeated bleaching events. Closer to home, the Great Barrier Reef lost 50% of its coral cover between 1985 and 2012.
A non-uniform response to warmingWhile the future of worldwide coral reefs looks dim, not all reefs will be at risk of recurrent bleaching at the same time. In particular, reefs located south of 15ºS (including the Great Barrier Reef, as well as islands in south Polynesia and Melanesia) are likely to be the last regions to be affected by harmful recurrent bleaching.
We used to think that Micronesia’s reefs would be among the first to die off, because the climate is warming faster there than in many other places. But our research, published today in Nature Climate Change, shows that the overall increase in temperature is not the only factor that affects coral bleaching response.
In fact, the key determinant of recurrent bleaching is the natural variability of ocean temperature. Under warming, temperature variations associated with seasons and climate processes like El Niño influence the pace of recurrent bleaching, and explain why some reefs will experience bleaching risk sooner than others in the future.
 Different zones of the Pacific are likely to experience differing amounts of climate variability.
Author provided
Different zones of the Pacific are likely to experience differing amounts of climate variability.
Author provided
 Degrees of future bleaching risk for corals in the three main Pacific zones.
Author provided
Degrees of future bleaching risk for corals in the three main Pacific zones.
Author provided
Our results suggest that El Niño events will continue to be the major drivers of mass bleaching events in the central Pacific. As average ocean temperatures rise, even mild El Niño events will have the potential to trigger widespread bleaching, meaning that these regions could face severe bleaching every three to five years within just a few decades. In contrast, only the strongest El Niño events will cause mass bleaching in the South Pacific.
In the future, the risk of recurrent bleaching will be more seasonally driven in the South Pacific. Once the global warming signal pushes summer temperatures to dangerously warm levels, the coral reefs will experience bleaching events every summers. In the western Pacific, the absence of natural variations of temperatures initially protects the coral reefs, but only a small warming increase can rapidly transition the coral reefs from a safe haven to a permanent bleaching situation.
Read more: Feeling helpless about the Great Barrier Reef? Here’s one way you can help
One consequence is that, for future projections of coral bleaching risk, the global warming rate is important but the details of the regional warming are not so much. The absence of consensus about regional patterns of warming across climate models is therefore less of an obstacle than previously thought, because globally averaged warming provided by climate models combined with locally observed sea temperature variations will give us better projections anyway.
Understanding the regional differences can help reef managers identify the reef areas that are at high risk of recurring bleaching events, and which ones are potential temporary safe havens. This can buy us valuable time in the battle to protect the world’s corals.
Clothilde Emilie Langlais was funded by the Pacific Australian Climate Science and Adaptation Program funded by AusAid.
Scott Heron receives funding and support from the U.S. National Oceanic and Atmospheric Administration's Satellites division (NESDIS) and Coral Reef Conservation Program, and is affiliated with James Cook University. The contents in this piece are solely the opinions of the authors and do not constitute a statement of policy, decision or position on behalf of NOAA or the U.S. Government.
Andrew Lenton does not work for, consult, own shares in or receive funding from any company or organization that would benefit from this article, and has disclosed no relevant affiliations beyond the academic appointment above.
Mercury from the northern hemisphere is ending up in Australia
 Mercury pollution, often released from gold mining and coal power stations, is a global problem. Shutterstock
Mercury pollution has a long legacy in the environment. Once released into the air, it can cycle between the atmosphere and ecosystems for years or even decades before ending up deep in the oceans or land.
The amount of mercury in the ocean today is about six times higher than it was before humans began to release it by mining. Even if we stopped all human mercury emissions now, ocean mercury would only decline by about half by 2100.
To address the global and long-lasting mercury problem, a new United Nations treaty called the Minamata Convention on Mercury came into effect last month. The treaty commits participating countries to limit the release of mercury and monitor the impacts on the environment. Australia signed the Convention in 2013 and is now considering ratification.
Read more: Why won’t Australia ratify an international deal to cut mercury pollution?
Until now, we have only been able to guess how much mercury might be in the air over tropical Australia. Our new research, published in the journal Atmospheric Chemistry and Physics, shows that there is less mercury in the Australian tropics than in the northern hemisphere – but that polluted northern hemisphere air occasionally comes to us.
A global problemWhile most of mercury’s health risks come from its accumulation in ocean food webs, its main entry point into the environment is through the atmosphere. Mercury in air comes from both natural sources and human activities, including mining and burning coal. One of the biggest mercury sources is small-scale gold mining – a trade that employs millions of people in developing countries but poses serious risks to human health and the environment.
Small-scale gold mining is an economic mainstay for millions of people, but it releases mercury directly into the air and water sources.Once released to the air, mercury can travel thousands of kilometres to end up in ecosystems far away from the original source.
Measuring mercury in the tropicsWhile the United Nations was gathering signatures for the Minamata Convention, we were busy measuring mercury at the Australian Tropical Atmospheric Research Station near Darwin. Our two years of measurements are the first in tropical Australia. They are also the only tropical mercury measurements anywhere in the Maritime Continent region covering southeast Asia, Indonesia, and northern Australia.
We found that mercury concentrations in the air above northern Australia are 30-40% lower than in the northern hemisphere. This makes sense; most of the world’s population lives north of the Equator, so most human-driven emissions are there too.
More surprising is the seasonal pattern in the data. There is more mercury in the air during the dry season than the wet season.
The Australian monsoon appears to be partly responsible for the seasonal change. The amount of mercury jumps up sharply at the start of the dry season when the winds shift from blowing over the ocean to blowing over the land.
 In the dry season the air passes over the Australian continent before arriving at the site, while in the wet season the air usually comes from over the ocean to the west of Darwin.
Howard et al., 2017 (modified)
In the dry season the air passes over the Australian continent before arriving at the site, while in the wet season the air usually comes from over the ocean to the west of Darwin.
Howard et al., 2017 (modified)
But wind direction can’t explain the whole story. Mercury is likely being removed from the air by the intense rains that characterise the wet season. In other words, the lower mercury in the air during the wet season may mean more mercury is being deposited to the ocean and the land at this time of year. Unfortunately, there simply isn’t enough information from Australian ecosystems to know how this impacts local plants and wildlife.
Fires also play a role. Mercury previously absorbed by grasses and trees can be released back to the atmosphere when the vegetation burns. In our data, we see occasional large mercury spikes associated with dry season fires. As we move into a bushfire season predicted to be unusually severe, we may see even more of these spikes.
Air from the northAlthough mercury levels were usually low in the wet season, on a few days each year the mercury jumped up dramatically.
To figure out where these spikes were coming from, we used two different models. These models combine our understanding of atmospheric physics with real observations of wind and other meteorological parameters.
Both models point to the same source: air transported from the north.
Australia is usually shielded from northern hemispheric air by a “chemical equator” that stops air from mixing. This barrier isn’t static – it moves north and south throughout the year as the position of the sun changes.
A few times a year, the chemical equator moves so far south that the top end of Australia actually falls within the atmospheric northern hemisphere. When this happens, polluted northern hemisphere air can flow directly to tropical Australia.
We observed 13 days when our measurement site near Darwin sampled more northern hemisphere air than southern hemisphere air. On each of these days, the amount of mercury in the air was much higher than on the days before or after.
Tracing the air backwards in time showed that the high-mercury air travelled over the Indonesian archipelago before arriving in Australia. We don’t yet know whether that mercury came from pollution, fires, or a mix of the two.
 The highest mercury is observed when the air comes from the northern hemisphere.
Howard et al., 2017 (modified)
A global solution
The highest mercury is observed when the air comes from the northern hemisphere.
Howard et al., 2017 (modified)
A global solution
To effectively reduce mercury exposure in sensitive ecosystems and seafood-dependent populations around the world, aggressive global action is necessary.
The cross-boundary influences on mercury that we have observed in northern Australia highlight the need for the type of multinational collaboration that the Minamata Convention will foster.
Our new data establish a baseline for monitoring the effectiveness of new actions taken under the Minamata Convention. With the first Conference of the Parties having taken place last week, hopefully it will only be a matter of time before we begin to see the benefit.
Jenny Fisher receives funding from the Australian Research Council and the L'Oréal-UNESCO For Women in Science Fellowship program.
Peter Nelson received funding from the Commonwealth Department of Environment, Water, Heritage and the Arts. He is co-lead of the UN Environment Partnership on Mercury Control from Coal Combustion.
Dean Howard and Grant C Edwards do not work for, consult, own shares in or receive funding from any company or organisation that would benefit from this article, and has disclosed no relevant affiliations beyond the academic appointment above.
From feral camels to 'cocaine hippos', large animals are rewilding the world
 Most of the world's wild horses, such as the Australian brumby, are outside their historic native range. Andrea Harvey
Throughout history, humans have taken plants and animals with them as they travelled the world. Those that survived the journey to establish populations in the diaspora have found new opportunities as they integrate into new ecosystems.
These immigrant populations have come to be regarded as “invaders” and “aliens” that threaten pristine nature. But for many species, migration may just be a way to survive the global extinction crisis.
In our recently published study, we found that one of the Earth’s most imperilled group of species is hanging on in part thanks to introduced populations.
Megafauna - plant-eating terrestrial mammals weighing more than 100kg - have established in new and unexpected places. These “feral” populations are rewilding the world with unique and fascinating ecological functions that had been lost for thousands of years.
Today’s world of giants is only a shadow of its former glory. Around 50,000 years ago, giant kangaroos, rhino-like diprotodons, and other unimaginable animals were lost from Australia.
Read more: Giant marsupials once migrated across an Australian Ice Age landscape
Later, around 12,000 years ago, the last of the mammoths, glyptodonts, several species of horses and camels, house-sized ground sloths and other great beasts vanished from North America.
In New Zealand, a mere 800 years ago, a riot of giant flightless birds still grazed and browsed the landscape.
The loss of Earth’s largest terrestrial animals at the end of the Pleistocene was most likely caused by humans.
Sadly, even those large beasts that survived that collapse are now being lost, with 60% of today’s megafauna threatened with extinction. This threat is leading to international calls for urgent intervention to save the last of Earth’s giants.
A wilder world than we thinkFormal conservation distribution maps show that much of Earth is empty of megafauna. But this is only a part of the picture.
Many megafauna are now found outside their historic native ranges. In fact, thanks to introduced populations, regional megafauna species richness is substantially higher today than at any other time during the past 10,000 years.
 Megafauna have expanded beyond their historic native range to rewild the world. Number of megafauna per region, in their ‘native’ range only (a) and in their full range (b)
Modified and reproduced from Lundgren et al. 2017
Megafauna have expanded beyond their historic native range to rewild the world. Number of megafauna per region, in their ‘native’ range only (a) and in their full range (b)
Modified and reproduced from Lundgren et al. 2017
Worldwide introductions have increased the number of megafauna by 11% in Africa and Asia, by 33% in Europe, by 57% in North America, by 62% in South America, and by 100% in Australia.
Australia lost all of its native megafauna tens of thousands of years ago, but today has eight introduced megafauna species, including the world’s only wild population of dromedary camels.
Australia lost all of its native megafauna tens of thousands of years ago, but is now home to eight introduced species, including the world’s only population of wild dromedary camels. Remote camera trap footage from our research program shows wild brumbies, wild donkeys and wild camels sharing water sources with Australian dingoes, emus and bustards in the deserts of South Australia.These immigrant megafauna have found critical sanctuary. Overall, 64% of introduced megafauna species are either threatened, extinct, or declining in their native ranges.
Some megafauna have survived thanks to domestication and subsequent “feralisation”, forming a bridge between the wild pre-agricultural landscapes of the early Holocene almost 10,000 years ago, to the wild post-industrial ecosystems of the Anthropocene today.
Wild cattle, for example, are descendants of the extinct aurochs. Meanwhile, the wild camels of Australia have brought back a species extinct in the wild for thousands of years. Likewise, the vast majority of the world’s wild horses and wild donkeys are feral.
There have been global calls to rewild the world, but rewilding has already been happening, often with little intention and in unexpected ways.
A small population of wild hippopotamuses has recently established in South America. The nicknamed “cocaine hippos” are the offspring of animals who escaped the abandoned hacienda of Colombian drug lord Pablo Escobar.
Colombia’s growing ‘cocaine hippo’ population is descended from animals kept at Pablo Escobar’s hacienda.By insisting that only idealised pre-human ecosystems are worth conserving, we overlook the fact that these emerging new forms of wilderness are not only common but critical to the survival of many existing ecosystems.
Vital functionsMegafauna are Earth’s tree-breakers, wood-eaters, hole-diggers, trailblazers, wallowers, nutrient-movers, and seed-carriers. By consuming coarse, fibrous plant matter they drive nutrient cycles that enrich soils, restructure plant communities, and help other species to survive.
The wide wanderings of megafauna move nutrients uphill that would otherwise wash downstream and into the oceans. These animals can be thought of as “nutrient pumps” that help maintain soil fertility. Megafauna also sustain communities of scavengers and predators.
In North America, we have found that introduced wild donkeys, locally known as “burros”, dig wells more than a metre deep to reach groundwater. At least 31 species use these wells, and in certain conditions they become nurseries for germinating trees.
Introduced wild donkeys (burros) are engineering the Sonoran Desert, United States.The removal of donkeys and other introduced megafauna to protect desert springs in North America and Australia seems to have led to an exuberant growth of wetland vegetation that constricted open water habitat, dried some springs, and ultimately resulted in the extinction of native fish. Ironically, land managers now simulate megafauna by manually removing vegetation.
It is likely that introduced megafauna are doing much more that remains unknown because we have yet to accept these organisms as having ecological value.
Living in a feral worldLike any other species, the presence of megafauna benefits some species while challenging others. Introduced megafauna can put huge pressure on plant communities, but this is also true of native megafauna.
Whether we consider the ecological roles of introduced species like burros and brumbies as desirable or not depends primarily on our own values. But one thing is certain: no species operates in isolation.
Although megafauna are very large, predators can have significant influence on them. In Australia, dingo packs act cooperatively to hunt wild donkeys, wild horses, wild water buffalo and wild boar. In North America, mountain lions have been shown to limit populations of wild horses in some areas of Nevada.
Visions of protected dingoes hunting introduced donkeys and Sambar deer in Australia, or protected wolves hunting introduced Oryx and horses in the American West, can give us a new perspective on conserving both native and introduced species.
Nature doesn’t stand still. Dispensing with visions of historic wilderness, and the associated brutal measures usually applied to enforce those ideals, and focusing on the wilderness that exists is both pragmatic and optimistic.
After all, in this age of mass extinction, are not all species worth conserving?
This research will be presented at the 2017 International Compassionate Conservation Conference in Sydney.
Daniel Ramp is the Director of the Centre for Compassionate Conservation (CfCC) at UTS. The CfCC collaborates with, and receives research grants from, a range of government, industry, and NGOs to work on conservation actions that address conservation problems and promote compassion for wild animals through peaceful coexistence. He is a Director of Voiceless, which is a funding partner of the Centre.
Arian Wallach, Erick Lundgren, and William Ripple do not work for, consult, own shares in or receive funding from any company or organisation that would benefit from this article, and has disclosed no relevant affiliations beyond the academic appointment above.
I've always wondered: Why don't hippos get cholera?
This is an article from I Have Always Wondered, a series where readers send in questions they’d like an expert to answer. Send your question to alwayswondered@theconversation.edu.au
Why don’t hippopotamuses get cholera? Why are some animals resistant to waterborne disease? – Phil Morey
The short answer is that cholera has evolved to infect humans, not hippos. Cholera is a disease caused by a curved rod-shaped bacterium called Vibrio cholerae. The disease is characterised by a profuse diarrhoea that resembles “rice water”, and can lead to death within hours.
 Transmission electron microsope image of Vibrio cholerae that has been negatively stained.
Dartmouth Electron Microscope Facility via Wikipedia
Transmission electron microsope image of Vibrio cholerae that has been negatively stained.
Dartmouth Electron Microscope Facility via Wikipedia
Humans contract the disease from water contaminated with human sewage containing the bacteria. As cholera is a waterborne disease, it is prevalent in areas where human sanitation is lacking or less than ideal. Unlike many other diseases, it can’t be passed to us from animals, as malaria is from mosquitoes.
Once ingested by humans, the bacteria attach to the small intestine wall. There they reproduce, and prodcue a toxin called choleragen. The choleragen toxin is made up of two parts, called A and B. The B portion attaches the toxin to the cells in the intestine and the A portion chemically forces electrolytes and water from the intestinal cells themselves, thus leading to massive dehydration, diminished blood loss and ultimately death.
Vibrio cholerae, the bacteria that causes cholera, only impacts humans, and can only be transmitted to new human hosts via contaminated water. It’s likely that the disease mechanism is precisely adapted to human-specific molecules in the cell walls of our small intestine, and the molecular structure of the bacteria’s toxins.
 The annotation on this 19th century medical illustration reads. ‘A young woman of Vienna, 23. The same woman one hour after the onset of cholera, and four hours before death.’
Wellcome Library, London, via Flickr/the lost gallery
The annotation on this 19th century medical illustration reads. ‘A young woman of Vienna, 23. The same woman one hour after the onset of cholera, and four hours before death.’
Wellcome Library, London, via Flickr/the lost gallery
Over millennia, both the disease-causing organism (pathogen) and host have been evolving counter-strategies against each other: the host to evade the pathogen, and pathogen to invade the host. These battles have led to the bacteria becoming host-specific, and now only able to infect humans.
The cholera vaccine works by taking advantage of this close host/pathogen relationship. It inhibits the action of the B portion of the cholera toxin, hence it prevents the bacteria from attaching to the intestinal wall.
Other waterborne diseases are caused by other pathogens (although the specific mechanisms or molecules involved differ). In some cases, as in cholera, the molecules required for infection are host-specific. Whilst other pathogens are not species specific, they are often associated with more closely-related species than less closely-related species. For example, foot and mouth disease affects cattle, sheep, deer and pigs, because they are all cloven-hoofed animals (Artiodatyla) and thus closely-related species.
Hippopotamuses (Hippopotamus amphibious and Choeropsis liberiensis) are more closely related to cetaceans (whales and dolphins), than humans, and therefore it is not surprising that they have different pathogens. That being said, hippopotamuses, like other animals, are likely to suffer from loose stools (dung) from time to time, whether due to other pathogens, or the quality of the huge amounts of plant material they ingest on a daily basis.
Dung is super important in hippopotamus society. Hippopotamus defecation or “dung showering” involves flicking their tail at the same time as defecating to distribute their dung far and wide, hence dung is used to mark their territory and assert dominance.
If hippopotamus dung spread a disease like cholera, it could be rapidly fatal for large populations. It is likely that the individuals affected would be removed by natural selection. Those that were resistant, or only mildly affected, would overcome the disease and live on to produce disease-resistant offspring. Over time, it is therefore likely hippopotamuses have adapted to their aquatic environments and thus rarely, if ever, become infected with waterborne diseases.
* Email your question to alwayswondered@theconversation.edu.au
* Tell us on Twitter by tagging @ConversationEDU with the hashtag #alwayswondered, or
* Tell us on Facebook
Julie Old does not work for, consult, own shares in or receive funding from any company or organisation that would benefit from this article, and has disclosed no relevant affiliations beyond the academic appointment above.
'No one is steering the ship': five lessons learned (or not) since the SA blackout
A year ago, the power system went down in South Australia. Homes and businesses across the state were without electricity for hours, some for days. While its specific causes have already been worked through, the nation’s most widespread blackout in decades quickly became a symbol of “Australia’s energy crisis”.
One year on, it is time to ask: how far have we come and what have we learned? Some progress has been made, but there is still a long way to go before Australians can rest assured that they have an affordable, reliable and sustainable energy system.
While politicians have been beating their chests, companies pleading their case, and energy institutions busying themselves with the search for solutions, five lessons have emerged from the great SA blackout.
Read more: Baffled by baseload? Dumbfounded by dispatchables? Here’s a glossary of the energy debate
1. Big storms cause blackouts – and blackouts cause big (media) stormsThere’s nothing quite like a blackout to focus the minds of politicians and industry alike, and generate momentum for energy policy reform.
In the blackout’s immediate aftermath, federal and state energy ministers together commissioned Chief Scientist Alan Finkel to review the National Electricity Market. Finkel presented his findings in June this year.
So far, 49 of his 50 recommendations have been accepted – all except the contentious Clean Energy Target. The blackout served as a reminder that electricity obeys the laws of physics, not of governments, and that system security is paramount. It has already prompted some important reforms that reduce the chances of future blackouts, such as new rules for extreme power system conditions and new obligations on network businesses.
2. Energy is now a political playthingWhile being in the spotlight has created the opportunity for much-needed reforms, it has also made energy policy a political plaything.
Consider the petty public stoush between Labor SA Premier Jay Weatherill and Liberal federal energy minister Josh Frydenberg in March, or the lump of coal that was passed around Federal Parliament back in February. Politicians have created a false contest between coal and renewables, instead of working together to fix the real policy problems.
Meanwhile, consumers have been left in the dark, both literally and metaphorically. Energy institutions and companies have largely failed to explain themselves, and what is going on, to the people that matter most.
Reports from the market operator, written in technical language for industry, have triggered media panic, and politicians have seized these moments to point the finger rather than reassure the public.
Read more: The day Australia was put on blackout alert
It’s not easy. These problems are complex, and no decent explanation will fit a media soundbite. But consumers must be brought along on the journey; confusion creates unnecessary fear, unhelpful reactions, and false expectations.
3. In a crisis, politicians will act – whether or not it helpsPoliticians are understandably keen to act to keep the lights on. The SA government responded by announcing a go-it-alone Energy Plan. Some other states, and the federal government, are now buying or contracting for new electricity generation and storage.
Some interventions help, but others could make matters worse. We have seen a lot of policy on the run in the past year, yet state and federal governments continue to ignore the policy changes that would make the biggest difference.
New generation and storage will be needed to bring down electricity prices, reduce emissions, and avoid supply shortfalls as older power stations are closed. Governments are jumping in to build that generation. But this could force existing generation out of the market, making the problem worse.
Industry has made it clear that policy stability, including a credible emissions reduction mechanism, is needed to enable appropriate investments to be made. Yet stability and predictability in energy and climate change policy have been sorely lacking over the past decade.
If governments can collectively agree to implement Finkel’s plan in full, this would give the market more certainty on how emissions will be cut over time, and how the entry of new technologies and the exit of old power stations will be managed.
Laying out a path from where we are today to where we want to be in future is essential. Without it, uncertainty will continue to paralyse investors and drive up electricity prices.
4. All hands are on deck, but no one is steering the shipThere is a lot going on, but it is still not clear where it is all headed. Since the blackout there has been unprecedented attention on the energy sector. Everyone is busily trying to solve this, but from their own “silo”.
The sector has always suffered from a bit of a leadership vacuum. The top policy body, the COAG Energy Council, can be compromised by partisan politics and conflicts of interest, or simply bogged down in process.
Yet it is important that Canberra works with the states and territories, because each government has different legislative levers and political priorities that affect the national energy system. Policy leadership will be crucial throughout the transition to a cleaner energy future. The COAG Energy Council needs to focus on the core strategic issues, and it will need clear guidance from the sector to do so.
5. We should be able to avoid blackouts this summer, but longer-term solutions are still neededWe are certainly better prepared for the coming summer as a result of lessons learned from the SA blackout and the renewed attention on energy policy reform. Back-up generation and demand-response schemes are being organised, new energy storage is being built, and this week Prime Minister Malcolm Turnbull struck a deal that should ensure adequate domestic gas supplies.
If all goes to plan, we should be able to avoid problems this summer. But we shouldn’t be relying on emergency measures every year. Longer-term solutions are needed, and these will require continued action, building on the momentum of the past year.
Read more: A year since the SA blackout, who’s winning the high-wattage power play?
The SA blackout was a wake-up call for the sector, triggering much-needed new thinking and some early reforms. But it has also thrown energy into the spotlight, requiring the sector to lift its game, particularly in communicating with the public and each other.
Looking back on the past year, we have come a long way, but it is still not clear where we are going and who will steer us there. Australians must hope that the new Energy Security Board, which includes the heads of the three main energy institutions, can help state and federal governments chart a steady course.
A shared sense of direction, across states and across party lines, is needed to focus the sector on the horizon, rather than on the waves below.
Kate Griffiths does not work for, consult, own shares in or receive funding from any company or organization that would benefit from this article, and has disclosed no relevant affiliations beyond the academic appointment above.
Debris from the 2011 tsunami carried hundreds of species across the Pacific Ocean
 Japanese vessel washed ashore on Long Beach, Washington being inspected by John Chapman. Russ Lewis
When a foreign species arrives in a new environment and spreads to cause some form of economic, health, or ecological harm, it’s called a biological invasion. Often stowing away among the cargo of ships and aircraft, such invaders cause billions of dollars of economic loss annually across the globe and have devastating impacts on the environment.
While the number of introductions which eventually lead to such invasions is rising across the globe, most accidental introduction events involve small numbers of individuals and species showing up in a new area.
But new research published today in Science has found that hundreds of marine species travelled from Japan to North America in the wake of the 2011 Tōhoku earthquake and tsunami (which struck the east coast of Japan with devastating consequences).
Read more: Widespread invasive species control is a risky business
Marine introductions result from biofouling, the process by which organisms start growing on virtually any submerged surface. Within days a slimy bacterial film develops. After months to a few years (depending on the water temperature) fully formed communities may be found, including algae, molluscs such as mussels, bryozoans, crustaceans, and other animals.
Current biosecurity measures, such as antifouling on ships and border surveillance, are designed to deal with a steady stream of potential invaders. But they are ill-equipped to deal with an introduction event of the scale recorded along most of the North American coast. This would be just as true for Australia, with its extensive coastlines, as it is for North America.
Mass marine migration Marine animals were transported vast distances on tsunami debris.
Carla Schaffer / AAAS
Marine animals were transported vast distances on tsunami debris.
Carla Schaffer / AAAS
This research, led by James Carlton of Williams College, shows that over a few years after the 2011 earthquake and tsunami, many marine organisms arrived along the west coast of North America on debris derived from human activity. The debris ranged from small pieces of plastic to buoys, to floating docks and damaged marine vessels. All of these items harboured organisms. Across the full range of debris surveyed, scores of individuals from roughly 300 species of marine creatures arrived alive. Most of them were new to North America.
The tsunami swept coastal infrastructure and many human artefacts out to sea. Items that had already been in the water before the tsunami carried their marine communities along with them. The North Pacific Current then transported these living communities across the Pacific to Alaska, British Columbia, Oregon, Washington and California.
 Japanese tsunami buoy with Japanese oyster Crassostrea gigas, found floating offshore of Alsea Bay, Oregon in 2012.
James T. Carlton
Japanese tsunami buoy with Japanese oyster Crassostrea gigas, found floating offshore of Alsea Bay, Oregon in 2012.
James T. Carlton
What makes this process unusual is the way a natural extreme event – the earthquake and associated tsunami – gave rise to an extraordinarily large introduction event because of its impact on coastal infrastructure. The researchers argue that this event is of unprecedented magnitude, constituting what they call “tsunami-driven megarafting”: rafting being the process by which organisms may travel across oceans on debris – natural or otherwise.
It’s not known how many of these new species will establish themselves and spread in their new environment. But, given what we know about the invasion process, it’s certain at least some will. Often, establishment and initial population growth is hidden, especially in marine species. Only once it is either costly or impossible to do something about a new species, is it detected.
Biosecurity surveillance systems are designed to overcome this problem, but surveillance of an entire coast for multiple species is a significant challenge.
Perhaps one of the largest questions the study raises is whether this was a once off event. Might similar future occurrences be expected? Given the rapid rate of coastal infrastructure development, the answer is clear: this adds a new dimension to coastal biosecurity that will have to be considered.
Investment in coastal planning and early warning systems will help, as will reductions in plastic pollution. But such investment may be of little value if action is not taken to adhere to, and then exceed, nationally determined contributions to the Paris Agreement. Without doing so, a climate change-driven sea level rise of more than 1 m by the end of the century may be expected. This will add significantly to the risks posed by the interactions between natural extreme events and the continued development of coastal infrastructure. In other words, this research has uncovered what might be an increasingly common new ecological process in the Anthropocene – the era of human-driven global change.
Steven Chown is the President of the Scientific Committee on Antarctic Research.
A year since the SA blackout, who's winning the high-wattage power play?
It’s a year to the day since the entire state of South Australia was plunged into darkness. And what a year it’s been, for energy policy geeks and political tragics alike.
Parked at the western end of the eastern states’ electricity grid, South Australia has long been an outlier, in energy policy as well as geography. Over the past decade it has had a tempestuous relationship with the federal government, be it Labor or Coalition. As with water policy, the South Australians often suspect they are being left high and dry by their upstream neighbours.
Read more: South Australia’s energy plan gives national regulators another headache
The policy chaos over the carbon price left the Renewable Energy Target as a far more prominent investment signal than it would otherwise have been. South Australia carried on attracting wind farms, which earned more than their fair share of the blame for high electricity prices.
On September 28, 2016, a “once-in-50-year storm” blew over a string of electricity pylons, tripping the whole state’s power grid. While the blackout, which lasted 5 hours in Adelaide and longer elsewhere, was still unfolding, critics of renewables took a leap into the dark as part of a wider blame game.
Despite being described as a “confected conflict”, the skirmish was serious enough to prompt the federal government to commission Chief Scientist Alan Finkel’s landmark review of the entire National Electricity Market, with a deadline of mid-2017.
Meanwhile, in early December, federal environment minister Josh Frydenberg was forced to backtrack after saying the Coalition was prepared to consider an emissions intensity scheme. SA Premier Jay Weatherill was unamused by the flip-flop and threatened to get together with other states to go it alone on carbon pricing.
February saw a series of “load shedding” events during a heatwave, which left some Adelaide homes once more without power and saw the grid wobble in NSW too. (It should be noted that the now infamous Liddell power station was unable to increase its output during the incident.)
Policy by tweetIt was then that Twitter entered the fray. The “accidental billionaire” Mike Cannon-Brookes was asking Solar City chief executive Lyndon Rive how quickly a battery storage system might be up and running. Rive’s cousin, a certain Elon Musk, intervened with his famous offer:
Within days, both Weatherill and Turnbull had had conversations with Musk, and Turnbull announced a “Snowy Hydro 2.0” storage proposal.
Meanwhile, Weatherill unveiled his SA Energy Plan, which the Guardian called a “survivalist fix of last resort”. We now know that the plan cost A$1 million to produce.
Then, on March 16, at the launch of a 5-megawatt “virtual power plant” in Adelaide, Weatherill had some choice words for Frydenberg who, entertainingly enough, was standing right next to him:
I’ve got to say, it is a little galling to be standing here, next to a man that’s been standing up with his prime minister, bagging South Australia at every step of the way over the last six months… And for you to then turn around, in a few short months, when there’s a blackout, and point the finger at SA for the fact that our leadership in renewable energy was the cause of that problem is an absolute disgrace.“
Frydenberg kept a notably low profile for a while after this.
Finkel fires upIn June, Finkel released his keenly awaited review. A significant number of Liberals and Nationals didn’t like his suggested Clean Energy Target, and immediately set about trying to insert coal into it.
Despite being conceived as an acceptable compromise, the Clean Energy Target was bashed from both sides. It was criticised as too weak to reach Australia’s emissions target and little more than "business as usual”, but was also “unconscionable” to former Prime Minister Tony Abbott.
Weatherill’s next major stand-alongside was an even bigger deal than the Frydenberg stoush. On July 7, he and Musk announced that part of his earlier energy SA plan would become reality: a 129-megawatt-hour lithium-ion battery farm, to be built alongside a wind farm in Jamestown.
Speaking at a book launch, Weatherill used the f-word to describe specific media opponents of renewables, earning himself opprobrium in the pages of The Australian, and admiration in more progressive areas of social media.
Federal treasurer Scott Morrison returned fire, deriding the battery farm as “a Big Banana”.
However, there was another big announcement in Weatherill’s locker: a A$650-million concentrated solar thermal power plant to be built near Port Augusta, with potential for more.
Quietly, the “energy security target” component of the SA plan, which had been rubbished, was deferred, while a renewables-based “minigrid” on the Yorke peninsula was announced.
Whatever next?What will happen now? “Events, dear boy, events,” as Harold MacMillan didn’t say. Musk is back in Adelaide to talk about his Mars mission, with an appearance scheduled for Jamestown. Would anyone bet against another SA government announcement? More batteries? Electric cars? Space planes…?
The Jamestown battery should come online in December (or it’s free!). Weatherill will presumably be hoping that Turnbull’s government staggers on, bleeding credibility and beefing up the anti-Liberal protest vote until the March 2018 state election, and that they continue to make themselves look a like a rabble over Finkel’s Clean Energy Target.
At the same time, he will also fervently hope there isn’t another big power crisis, and that the A$2.6 million of public money he spent making sure everyone knows about his energy plans provides effective insulation from any shocks.
Read more: Explainer: what can Tesla’s giant South Australian battery achieve?
The whole saga shows how policy windows can open up in unexpected ways. An attempt to blast a new technology fails, and a politician at state level sees no option but to act because of federal inadequacy. It’s happening in California too.
Judging by his interviews with me and the Guardian’s Katharine Murphy, Weatherill has found his signature issue – making lemonade from the huge lemon he was served last September. As another commentator wrote:
Far from being the last nail in the Weatherill government’s electoral coffin, the power crisis has perversely breathed new life into Labor’s re-election hopes… It is turning its own failures on energy security into a single-issue platform on which to campaign.
Weatherill is trying to build an innovation ecosystem for clean energy technology. Announcing a tender last month, Weatherill said his government is “looking for the next generation of renewable technologies and demand-management technologies to maintain our global leadership”.
And when do applications for that tender close? Well, it may be a coincidence, but the deadline is 5pm today – exactly a year since his state’s darkest hour.